





Thirteen of Thirteen Holes Intersect Sulfide Mineralization Across 9,800 Feet of Strike Length
TORONTO, Nov. 5, 2026 /CNW/ — Edge Copper Corporation (TSX: EDCU) (“Edge Copper” or the “Company”) announces a large porphyry-style hypogene (sulfide) copper-gold-silver-molybdenum (Cu-Au-Ag-Mo) discovery immediately beneath the oxide porphyry copper deposit at its 100%-owned Zonia Copper Project (“Zonia” or the “Project”) in Arizona. All 13 holes drilled below the oxide deposit have intersected sulfide mineralization along approximately 9,800 feet (ft) (2,980 metres (m)) of strike length; seven were extended to test it at depth.
Induced polarization (IP) surveys outline a substantially larger chargeability footprint approximately 16,400 ft (5,000 m) long and 3,300 ft (1,000 m) wide at 2,000 ft (600 m) depth. Widely spaced drilling has tested approximately 60% of that strike length, and several of the deepest holes ended in mineralization.
Discovery Highlights
- Scale and continuity All 13 holes drilled below the oxide deposit intersected sulfide Cu-Au-Ag-Mo mineralization over approximately 9,800 ft of strike. Six were oxide definition holes stopped shortly after entering sulfide; seven were extended to test sulfide Cu-Au-Ag-Mo mineralization at depth. The IP footprint extends approximately 16,400 ft along strike, indicating that the system is larger than the area drilled to date.
- ZND0063 Intersected 876 ft grading 0.38% Copper Equivalent (CuEq) (0.26% Total Copper (CuT), 0.10 g/t Au, 1.29 g/t Ag and 62 ppm Mo) from 1,075 ft to the end of the hole at 1,951 ft. Includes:
- 80 ft of 0.57% CuEq (0.40% CuT, 0.16 g/t Au, 2.30 g/t Ag and 43 ppm Mo) from 1,715 ft; and,
- 40 ft of 0.70% CuEq (0.52% CuT, 0.16 g/t Au, 3.05 g/t Ag and 45 ppm Mo) from 1,825 ft. The hole ended in mineralization.
- ZND0068 Returned 423 ft grading 0.50% CuEq (0.34% CuT, 0.14 g/t Au, 1.04 g/t Ag and 91 ppm Mo) from 469 ft to the end of the hole. Includes:
- 71 ft of 0.64% CuEq (0.42% CuT, 0.16 g/t Au, 1.18 g/t Ag and 218 ppm Mo); and,
- 113 ft of 0.62% CuEq (0.43% CuT, 0.16 g/t Au, 1.28 g/t Ag and 100 ppm Mo).
- ZND0058 Returned 775 ft grading 0.34% CuEq (0.24% CuT, 0.08 g/t Au, 1.83 g/t Ag and 49 ppm Mo) from 1,260 ft. Includes:
- 90 ft of 0.55% CuEq (0.33% CuT, 0.23 g/t Au, 2.51 g/t Ag and 11 ppm Mo); and,
- 50 ft of 0.67% CuEq (0.42% CuT, 0.24 g/t Au, 2.76 g/t Ag and 48 ppm Mo).
- ZND0060 Returned 50 ft interval of 0.69% CuEq (0.41% CuT, 0.29 g/t Au, 2.38 g/t Ag and 7 ppm Mo) from 1,198 ft and 499 ft grading 0.36% CuEq (0.23% CuT, 0.10 g/t Au, 1.73 g/t Ag and 64 ppm Mo) from 1,289 ft. Includes:
- 70 ft of 0.47% CuEq (0.32% CuT, 0.13 g/t Au, 2.23 g/t Ag and 33 ppm Mo).
- ZND0019 Returned 416 ft grading 0.41% CuEq (0.26% CuT, 0.14 g/t Au, 1.77 g/t Ag and 35 ppm Mo) from 886 ft to the end of the hole. Includes:
- 80 ft of 0.51% CuEq (0.33% CuT, 0.19 g/t Au, 1.90 g/t Ag and 9 ppm Mo); and,
- 20 ft of 1.01% CuEq (0.62% CuT, 0.40 g/t Au, 4.10 g/t Ag and 20 ppm Mo).
“This is a major discovery at Zonia,” said Gil Clausen, Chair and CEO of Edge Copper. “Every hole drilled below the oxide deposit intersected sulfide mineralization, several of the deepest holes ended in mineralization, and the geophysics indicates the system extends well beyond the drilling completed to date. We now have a compelling foundation to evaluate the scale and higher-grade zones of this newly recognized Cu-Au-Ag-Mo porphyry system while continuing to advance the oxide project.”
“The higher-grade Cu-Au-Ag-Mo mineralization at Zonia is associated with abundant A-quartz veins and intense potassic alteration, the same assemblage that characterizes the high-grade cores of many classic porphyry copper systems worldwide,” said Dr. Patrick Redmond, Ph.D., P.Geo., Qualified Person and exploration consultant to Edge Copper. “We see this style in multiple holes, and ZND0063, the deepest hole by vertical depth, ended in the same style of mineralization. Together with the geophysics, the drilling indicates a large sulfide porphyry system with multiple centres and localized higher-grade Cu-Au-Ag-Mo zones within a broader mineralized envelope. The system remains open laterally and at depth.”
Drilling Defines a Large Open Sulfide System
The 2026 program was designed primarily to define the oxide copper deposit, so most holes were stopped shortly after entering the underlying sulfide zone.
The principal result, ZND0063, intersected oxide copper mineralization grading 0.33% Total Copper (CuT) over 277 ft from surface, as previously reported on October 7, 2026. Immediately below the base of oxide, the hole intersected the following:
- 138 ft grading 0.37% CuEq (0.26% CuT, 0.09 g/t Au, 1.48 g/t Ag and 62 ppm Mo) from 277 ft to 415 ft.
- 410 ft grading 0.29% CuEq (0.19% CuT, 0.07 g/t Au, 1.63 g/t Ag and 54 ppm Mo) between 565 ft and 1,045 ft.
- 876 ft grading 0.38% CuEq (0.26% CuT, 0.10 g/t Au, 1.29 g/t Ag and 62 ppm Mo) from 1,075 ft to the end of the hole at 1,951 ft. Including:
- 80 ft of 0.57% CuEq (0.40% CuT, 0.16 g/t Au, 2.30 g/t Ag and 43 ppm Mo) from 1,715 ft
- 40 ft of 0.70% CuEq (0.52% CuT, 0.16 g/t Au, 3.05 g/t Ag and 45 ppm Mo) from 1,825 ft.
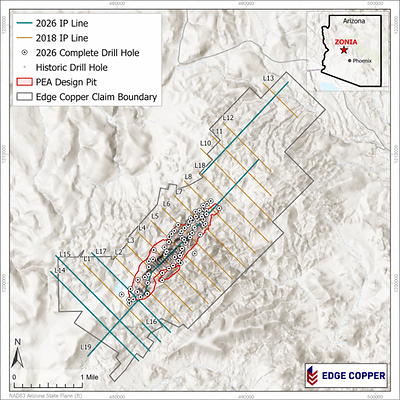
The hole ended when the drill rods tightened, still in mineralization. Please see Figure 1 for a Drill Hole Location Map and Figures 2-4 for Cross Sections.
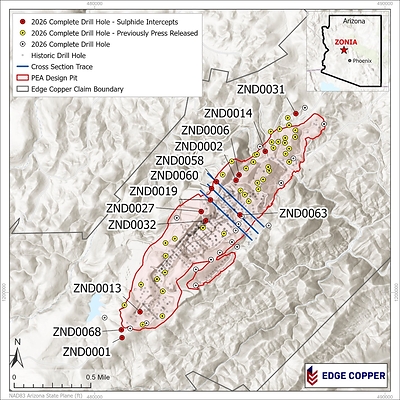
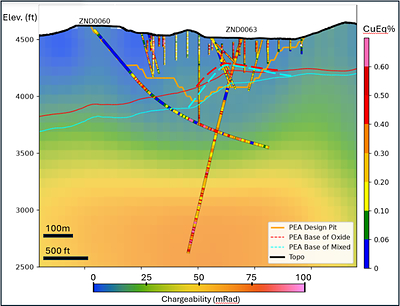
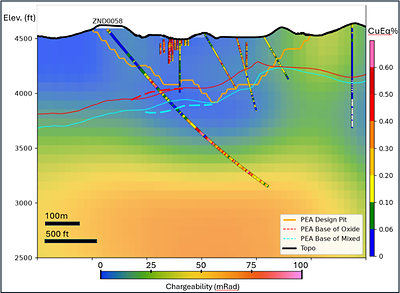
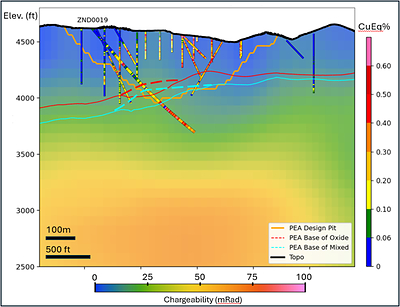
Sulfide mineralization has been intersected from ZND0001 at the southwest end of the 2026 Preliminary Economic Assessment (PEA) pit to ZND0031 at the northeast; a strike length of approximately 9,800 ft (2,980 m). The IP data indicate a larger system: anomalous chargeability extends approximately 16,400 ft (5,000 m) along strike, and widely spaced drilling has tested approximately 60% of that length. The deeper holes demonstrate porphyry-style mineralization continuing to more than 2,000 ft (600 m) down-hole, with the deepest holes ending in mineralization.
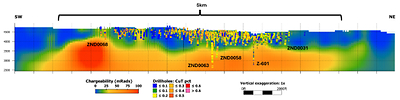
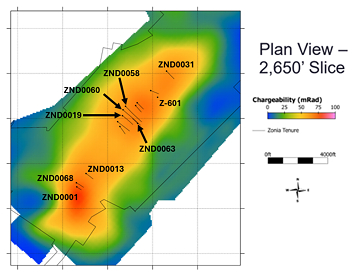
Two induced polarization (IP) and resistivity surveys cover Zonia: 13 historical northwest-southeast lines (about 28 line-km) acquired in 2018 by hydroGEOPHYSICS (now Certerra Subsurface Imaging), and six recent lines (about 20 line-km), including a 6.0 km spectral IP line along the axis of the deposit, acquired in 2026 by Zonge International under Certerra’s management. Both used time-domain dipole-dipole arrays with 200 m dipoles, and the data were combined in a 3D inversion by Mira Geoscience. The surveys show a single coherent chargeable body striking northeast-southwest. See Figure 5-7 for IP survey results.
Oxide intervals from 12 of the 13 holes in this news release were previously reported. The exception is ZND0068, whose oxide copper intercept is reported here for the first time and identified as oxide mineralization in Table 2.
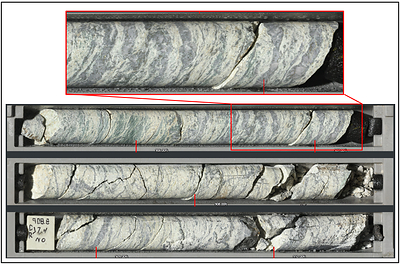
These results bring the number of holes reported from the current, and recently increased, 65,000-foot program to 54. Complete drill hole details, significant intercepts, and copper equivalent calculations and assumptions are provided in Appendix A. Core photos from drill hole ZND0019 showing abundant A-quartz veins are shown in Appendix B.
The sulfide mineralization is not included in the Company’s 2026 PEA, and no Mineral Resource has been estimated for it.
Advancing the Oxide Project and Sulfide Discovery
Edge Copper is incorporating the new results into updated geological and resource models for Zonia. Current work includes:
Oxide Copper Deposit
- Complete the remaining oxide drill program, which is designed to define the extent of the oxide deposit and is expected to finish by mid-November;
- Refine the oxide, mixed and sulfide boundaries using sequential copper analyses and core scanning data;
- Advance metallurgical test work on representative oxide mineralization;
- Receive final assay data on all drill holes and progress the technical work required to support an updated Mineral Resource estimate for the oxide deposit in Q1 2027, followed by an updated PEA based on the upgraded and expanded oxide Mineral Resource estimate.
Sulfide Discovery
- Integrate oriented core, geological logging, core scanning and IP data into a geological model of the sulfide system;
- Complete interpretation of the 2026 IP surveys, including the long spectral IP line along the axis of the deposit, to define the system’s strike and depth extent;
- Evaluate the continuity and geometry of the higher-grade intervals in ZND0068, ZND0013, ZND0063 and ZND0058;
- Plan systematic deeper drilling in 2027 to test the sulfide system along the length of the chargeability anomaly
The Company expects to continue reporting drill results through 2026 as assays, QA/QC review and geological interpretation are completed.
Quality Assurance and Quality Control
All drill samples were collected under the supervision of the Company’s geological staff in accordance with industry-standard quality assurance and quality control (“QA/QC”) procedures. Samples are from HQ-diameter core. Core is scanned and logged by the Company’s geology team before being cut. Half-core HQ samples are prepared for assay, and the remaining material is retained at site for future reference.
The Company’s QA/QC program includes the insertion of certified reference materials, blanks and duplicate samples at regular intervals within the sample stream. The Company also conducts ongoing reviews of laboratory QA/QC performance to ensure analytical reliability and accuracy.
Assay samples were picked up directly from site by Skyline Assayers and Laboratories (“Skyline”) and transported to Skyline’s laboratory facility in Tucson, Arizona for preparation and analysis. Skyline is accredited and independent of the Company.
Sample preparation included drying, crushing, splitting and pulverizing prior to analysis. Copper assays were determined using Skyline’s single-element assay method, consisting of three-acid digestion followed by atomic absorption spectroscopy (AAS) determination for total copper.
Significant sulfide intervals reported in this news release were calculated using a 0.15% CuT cut-off, allowing a maximum of 20 ft of consecutive internal material below cut-off, with a composite average at or above the cut-off and a minimum length of 20 ft. Higher-grade including intervals were calculated using a 0.30% CuT cut-off with the same internal dilution and minimum length criteria and must grade higher than the parent interval. The oxide interval was calculated using a 0.10% CuT cut-off. All drill core is oriented where possible. Twelve of the 13 holes were drilled toward the southeast (azimuths 115° to 146°) at inclinations of -45° to -52°, broadly orthogonal to the interpreted strike of the mineralized system. ZND0063 was drilled toward the northwest (azimuth 315°) at an inclination of -73°, reaching approximately 1,870 ft (570 m) vertical depth, the deepest of the program. Because ZND0063 was drilled down the northwest dip of the porphyry system, its down-hole lengths may exceed true thickness. Intervals reported in this news release are down-hole lengths; true thicknesses have not been determined.
Qualified Person
The scientific and technical information contained in this news release has been approved by Patrick B. Redmond, Ph.D., P.Geo., a consultant to the Company, who is a Qualified Person as defined by National Instrument 43-101 – Standards of Disclosure for Mineral Projects. Dr. Redmond has verified the technical data supporting this news release by reviewing assay data, QA/QC results, drill logs, sampling records and drill hole collar/survey information.
About Edge Copper Corporation
Edge Copper Corporation is a copper-focused exploration and development company advancing its 100%-owned Zonia Copper Project in Arizona. Zonia is a past-producing heap-leach copper operation in Arizona’s historic Walnut Grove mining district, supported by existing infrastructure and a current Preliminary Economic Assessment. Edge Copper is advancing oxide resource expansion, metallurgical optimization and technical studies while evaluating the newly identified sulfide copper-gold-silver system. For more information, please visit www.edgecopper.com.
Further information
For further information regarding Edge Copper:
Letitia Wong
President
Telephone: +1 604 307-1128
Email: investor@edgecopper.com
Forward Looking Statements
This news release contains forward-looking information within the meaning of applicable securities laws. Forward-looking information includes, without limitation, statements regarding the completion, timing and objectives of the remaining oxide drilling; interpretation of the sulfide mineralization and IP surveys; the potential scale, continuity, geometry, higher-grade zones and lateral or depth extent of the sulfide system; planning and execution of additional deeper drilling; updates to geological and resource models; metallurgical test work; the timing of an updated Mineral Resource estimate for the oxide deposit; and continued reporting of drill results.
Forward-looking information is based on assumptions that management believes to be reasonable as of the date of this news release, including assumptions regarding assay turnaround times, drill performance, geological continuity, interpretation of drilling, scanning and geophysical data, laboratory and metallurgical performance, availability of personnel and equipment, copper prices, financing, permitting and regulatory requirements, and the Company’s ability to complete planned exploration and technical work.
Forward-looking information is subject to known and unknown risks, uncertainties and other factors that may cause actual results, performance or achievements to differ materially from those expressed or implied, including risks related to exploration and development, uncertainty in geological and geophysical interpretation and Mineral Resource estimates, metallurgical recovery, commodity prices, financing, permitting, title, environmental matters, availability of personnel and equipment, and general economic and market conditions.
Statements regarding the potential scale, continuity, geometry, higher-grade zones, lateral or depth extent, resource conversion, resource expansion or deposit limits are conceptual and forward-looking and do not constitute a new or updated Mineral Resource estimate. There is no certainty that the current program will result in a Mineral Resource for the sulfide system, an expanded Mineral Resource for the oxide deposit, a change in resource classification or any revised production profile. Readers are cautioned not to place undue reliance on forward-looking information. Except as required by applicable securities laws, the Company undertakes no obligation to update or revise such information.
Appendix A Drill Hole Data
|
Hole ID |
Easting (ft) |
Northing (ft) |
Elevation (ft) |
Azimuth (°) |
Dip (°) |
Total Depth |
|
ZND0001 |
480942 |
1198441 |
4686 |
125 |
-50 |
616 |
|
ZND0002 |
484869 |
1203862 |
4411 |
138 |
-48 |
843 |
|
ZND0006 |
484972 |
1204047 |
4431 |
136 |
-48 |
855 |
|
ZND0013 |
481560 |
1199329 |
4710 |
128 |
-45 |
796 |
|
ZND0014 |
485875 |
1204859 |
4352 |
115 |
-52 |
839 |
|
ZND0019 |
483991 |
1203186 |
4616 |
130 |
-49 |
1302 |
|
ZND0027 |
483669 |
1202786 |
4682 |
130 |
-45 |
1359 |
|
ZND0031 |
486930 |
1206158 |
4480 |
135 |
-45 |
993 |
|
ZND0032 |
483820 |
1202465 |
4591 |
146 |
-49 |
872 |
|
ZND0058 |
484195 |
1203815 |
4617 |
135 |
-50 |
2112 |
|
ZND0060 |
484027 |
1203580 |
4617 |
135 |
-50 |
1961 |
|
ZND0063 |
484999 |
1202670 |
4507 |
315 |
-73 |
1951 |
|
ZND0068 |
480920 |
1198711 |
4782 |
125 |
-45 |
892 |
Notes: Coordinates are in Arizona State Plane (EPSG:2223). Total depth is rounded to the nearest foot. Actual hole dips are reported in the table; twelve holes were drilled toward the southeast (azimuths 115° to 146°) at dips of -45° to -52°, and ZND0063 was drilled toward the northwest (azimuth 315°) at a dip of -73°.
TABLE 2 SIGNIFICANT INTERCEPTS
|
Hole ID |
From (ft) |
To (ft) |
Length (ft) |
CuT (%) |
Au (g/t) |
Ag (g/t) |
Mo |
CuEq (%) |
Type |
|
ZND0001† |
392 |
412 |
20 |
0.21 |
0.09 |
NA |
NA |
0.21 |
Sulfide |
|
ZND0001† |
442 |
616 |
174 |
0.28 |
0.14 |
1.27 |
53.32 |
0.43 |
Sulfide |
|
Including |
442 |
462 |
20 |
0.34 |
0.15 |
1.10 |
35.00 |
0.49 |
Sulfide |
|
Including |
502 |
552 |
50 |
0.33 |
0.20 |
1.02 |
62.00 |
0.53 |
Sulfide |
|
ZND0002† |
653 |
793 |
140 |
0.20 |
0.12 |
1.63 |
21.48 |
0.33 |
Sulfide |
|
Including |
723 |
753 |
30 |
0.30 |
0.21 |
1.57 |
13.60 |
0.50 |
Sulfide |
|
ZND0006† |
665 |
855 |
190 |
0.20 |
0.10 |
1.62 |
8.23 |
0.31 |
Sulfide |
|
ZND0013 |
270 |
310 |
40 |
0.30 |
0.24 |
1.95 |
62.50 |
0.54 |
Sulfide |
|
ZND0013 |
510 |
641 |
131 |
0.30 |
0.19 |
1.38 |
146.45 |
0.53 |
Sulfide |
|
Including |
530 |
626 |
96 |
0.34 |
0.20 |
1.57 |
190.21 |
0.60 |
Sulfide |
|
ZND0013 |
671 |
725 |
54 |
0.21 |
0.14 |
1.08 |
36.50 |
0.35 |
Sulfide |
|
ZND0014† |
753 |
839 |
86 |
0.22 |
0.02 |
1.40 |
40.09 |
0.27 |
Sulfide |
|
ZND0019 |
756 |
776 |
20 |
0.21 |
0.09 |
1.24 |
44.15 |
0.31 |
Sulfide |
|
ZND0019 |
826 |
856 |
30 |
0.15 |
0.06 |
1.23 |
56.67 |
0.24 |
Sulfide |
|
ZND0019 |
886 |
1302 |
416 |
0.26 |
0.14 |
1.77 |
34.96 |
0.41 |
Sulfide |
|
Including |
896 |
916 |
20 |
0.62 |
0.40 |
4.10 |
20.00 |
1.01 |
Sulfide |
|
Including |
960 |
1040 |
80 |
0.33 |
0.19 |
1.90 |
8.51 |
0.51 |
Sulfide |
|
Including |
1070 |
1120 |
50 |
0.31 |
0.16 |
2.52 |
64.00 |
0.50 |
Sulfide |
|
Including |
1160 |
1200 |
40 |
0.30 |
0.15 |
1.58 |
70.00 |
0.47 |
Sulfide |
|
ZND0027 |
889 |
1126 |
237 |
0.34 |
0.13 |
1.77 |
87.78 |
0.50 |
Sulfide |
|
Including |
889 |
1039 |
150 |
0.39 |
0.16 |
2.04 |
69.33 |
0.58 |
Sulfide |
|
ZND0027 |
1156 |
1247 |
91 |
0.20 |
0.04 |
1.76 |
118.60 |
0.30 |
Sulfide |
|
ZND0031† |
810 |
930 |
120 |
0.21 |
0.03 |
1.33 |
95.00 |
0.28 |
Sulfide |
|
ZND0031† |
960 |
990 |
30 |
0.24 |
0.04 |
2.03 |
150.00 |
0.34 |
Sulfide |
|
ZND0032† |
800 |
872 |
72 |
0.27 |
0.05 |
1.94 |
102.88 |
0.38 |
Sulfide |
|
ZND0058 |
1147 |
1200 |
53 |
0.18 |
0.07 |
1.98 |
19.32 |
0.27 |
Sulfide |
|
ZND0058 |
1260 |
2035 |
775 |
0.24 |
0.08 |
1.83 |
48.55 |
0.34 |
Sulfide |
|
Including |
1260 |
1350 |
90 |
0.33 |
0.23 |
2.51 |
11.04 |
0.55 |
Sulfide |
|
Including |
1380 |
1430 |
50 |
0.42 |
0.24 |
2.76 |
48.00 |
0.67 |
Sulfide |
|
Including |
1460 |
1491 |
31 |
0.48 |
0.03 |
2.76 |
80.22 |
0.56 |
Sulfide |
|
Including |
1526 |
1566 |
40 |
0.32 |
0.03 |
2.48 |
65.00 |
0.39 |
Sulfide |
|
Including |
1855 |
1905 |
50 |
0.31 |
0.06 |
2.34 |
98.00 |
0.42 |
Sulfide |
|
ZND0058 |
2075 |
2095 |
20 |
0.18 |
0.03 |
1.15 |
40.00 |
0.23 |
Sulfide |
|
ZND0060 |
1198 |
1248 |
50 |
0.41 |
0.29 |
2.38 |
7.00 |
0.69 |
Sulfide |
|
Including |
1208 |
1248 |
40 |
0.45 |
0.29 |
2.58 |
7.50 |
0.73 |
Sulfide |
|
ZND0060 |
1289 |
1788 |
499 |
0.23 |
0.10 |
1.73 |
63.79 |
0.36 |
Sulfide |
|
Including |
1339 |
1368 |
29 |
0.40 |
0.47 |
2.48 |
43.90 |
0.84 |
Sulfide |
|
Including |
1418 |
1488 |
70 |
0.32 |
0.13 |
2.23 |
32.86 |
0.47 |
Sulfide |
|
ZND0060 |
1818 |
1908 |
90 |
0.18 |
0.03 |
1.19 |
32.22 |
0.23 |
Sulfide |
|
ZND0063 |
277 |
415 |
138 |
0.26 |
0.09 |
1.48 |
61.79 |
0.37 |
Sulfide |
|
Including |
325 |
355 |
30 |
0.35 |
0.17 |
1.70 |
56.67 |
0.53 |
Sulfide |
|
ZND0063 |
565 |
715 |
150 |
0.19 |
0.07 |
1.36 |
53.33 |
0.29 |
Sulfide |
|
Including |
665 |
695 |
30 |
0.30 |
0.13 |
1.90 |
36.67 |
0.44 |
Sulfide |
|
ZND0063 |
745 |
885 |
140 |
0.19 |
0.07 |
1.12 |
48.57 |
0.28 |
Sulfide |
|
ZND0063 |
925 |
1045 |
120 |
0.19 |
0.05 |
2.56 |
60.83 |
0.29 |
Sulfide |
|
ZND0063 |
1075 |
1951 |
876 |
0.26 |
0.10 |
1.29 |
61.56 |
0.38 |
Sulfide |
|
Including |
1215 |
1245 |
30 |
0.38 |
0.12 |
1.57 |
313.33 |
0.62 |
Sulfide |
|
Including |
1495 |
1525 |
30 |
0.31 |
0.13 |
1.60 |
106.67 |
0.48 |
Sulfide |
|
Including |
1665 |
1685 |
20 |
0.44 |
0.14 |
2.55 |
400.00 |
0.72 |
Sulfide |
|
Including |
1715 |
1795 |
80 |
0.40 |
0.16 |
2.30 |
42.50 |
0.57 |
Sulfide |
|
Including |
1825 |
1865 |
40 |
0.52 |
0.16 |
3.05 |
45.00 |
0.70 |
Sulfide |
|
ZND0068 |
200 |
355 |
155 |
0.29 |
NA |
NA |
NA |
0.29 |
Oxide |
|
ZND0068 |
469 |
892 |
423 |
0.34 |
0.14 |
1.04 |
91.47 |
0.50 |
Sulfide |
|
Including |
469 |
540 |
71 |
0.42 |
0.16 |
1.18 |
218.41 |
0.64 |
Sulfide |
|
Including |
580 |
715 |
135 |
0.35 |
0.16 |
1.14 |
62.27 |
0.52 |
Sulfide |
|
Including |
779 |
892 |
113 |
0.43 |
0.16 |
1.28 |
99.99 |
0.62 |
Sulfide |
Notes: From and To are down-hole depths rounded to the nearest foot. Significant sulfide intervals use a 0.15% CuT cut-off, up to 20 ft of consecutive internal material below cut-off, a composite average at or above the cut-off and a minimum length of 20 ft. Including intervals use a 0.30% CuT cut-off with the same internal dilution and minimum length criteria and must grade higher than the parent interval. The oxide interval uses a 0.10% CuT cut-off. NA indicates assays not available. CuT is total copper; CuEq(%) = CuT(%) + (0.839 × Au(g/t)) + (0.0115 × Ag(g/t)) + (0.000359 × Mo(ppm)). Copper price used was $4.60 per pound, gold price used was $3,306 per ounce, silver price used was $43.96 per ounce and molybdenum price used was $23.41 per pound. Gold, silver and molybdenum prices were determined using three-year trailing averages; the copper price is the 2026 PEA base-case price. Metal recoveries assumed were 85% for copper, 68% for gold, 70% for silver and 60% for molybdenum. Recoveries are assumptions based on comparable porphyry projects and not confirmed by Zonia sulfide test work. Type identifies oxide or sulfide mineralization. The base of oxide is the Company’s interpretation based on visual logging and scanning; final modelling will incorporate sequential copper analyses. HQ core is oriented where possible. Twelve holes were drilled toward the southeast at inclinations of -45° to -52° and ZND0063 toward the northwest at -73°. Reported intervals are down-hole lengths; true thicknesses have not been determined. QA/QC includes duplicates, certified reference materials and blanks; Skyline Assayers and Laboratories performed all assays.
† Oxide definition hole stopped shortly after entering sulfide (72 to 253 ft below the top of the sulfide zone): ZND0001, ZND0002, ZND0006, ZND0014, ZND0031 and ZND0032. Sulfide intervals in these holes reflect where drilling stopped, not the extent of mineralization; five of the six ended in, or within 3 ft of, sulfide mineralization at or above the 0.15% CuT cut-off, and ZND0002 ended in lower-grade sulfide averaging about 0.14% CuT. The other seven holes were extended 423 to 1,674 ft below the top of the sulfide zone to test it at depth.
APPENDIX B

SOURCE Edge Copper Corporation
Source: https://rss.releasewire.net/feeds/release/20261105C5295